
Reading path: Ocean depth and big questions →
Depth labels and what they mean
| Question or feature | Explanation | What it does not establish |
|---|---|---|
| Euphotic zone | Surface to about 200 m in NOAA’s simplified scheme. [1] | Light penetration varies with clarity, season and location. |
| Dysphotic zone | Conventionally shown from 200 to 1,000 m. [1] | Boundaries are educational conventions, not universal cutoffs. |
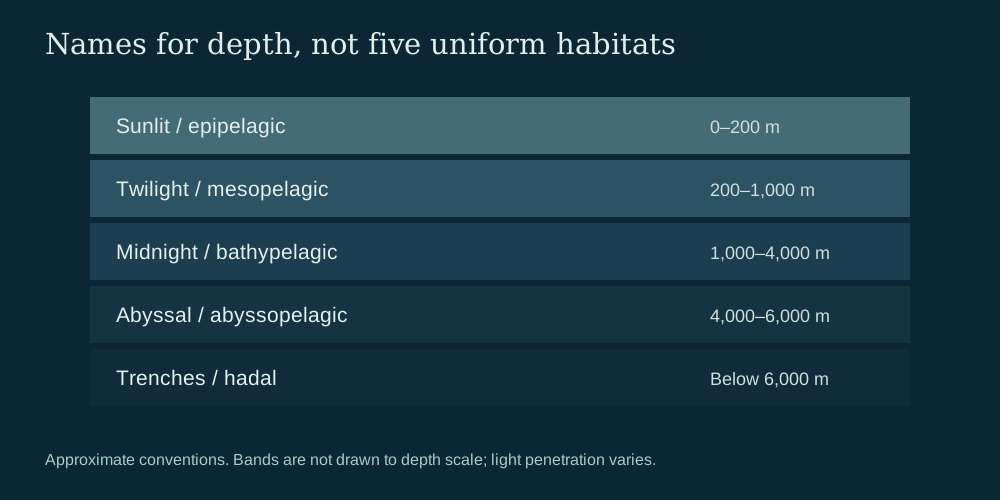
| Aphotic and deep-water bands | Aphotic begins below about 1,000 m; bathypelagic 1,000–4,000 m, abyssopelagic 4,000–6,000 m, hadal 6,000 m and deeper. [1] | Depth zones differ from light zones and seafloor habitats. |
| Pressure and adaptation | Pressure rises with depth, and organisms have varied environmental adaptations. [2] | A schematic does not establish a universal temperature or oxygen profile. |
Start with the scale, not the labels
A useful ocean diagram needs a clear vertical ruler. In NOAA’s simplified scheme, the euphotic, or sunlit, zone extends from the surface to about 200 metres. The dysphotic, or twilight, zone runs from 200 to 1,000 metres, and the aphotic zone begins below about 1,000 metres. [1]
These are conventional boundaries, not sharp edges in the water. How far light penetrates varies with water clarity, season and location. Faint light may persist below the productive sunlit layer, while photosynthesis needs sufficient light. A diagram’s 200-metre mark therefore helps organize information without claiming that light stops everywhere at precisely that depth. [1]
Depth zones extend into darkness
Within the dark-water scheme, NOAA’s guide places the bathypelagic zone at about 1,000–4,000 metres, the abyssopelagic zone at about 4,000–6,000 metres and the hadal zone at 6,000 metres and deeper. Those labels describe depth bands in the water column; they are not measures of how much light reaches a particular location. [1]
Pressure rises with depth, and organisms show varied adaptations to their environments. That broad relationship is useful context for an illustration, but the supplied zone guides do not establish a universal temperature or oxygen profile, nor do they make every organism’s range fit a single icon or band. [2] [1]
Keep water column and seabed separate
Pelagic zones classify the water column. A seafloor habitat is a different kind of place: a depth band can pass above different bottom terrain, and a seabed label does not tell the reader which light conditions occur in the water above it. NOAA’s layer guide relates depth, light, pressure and adaptation, while the light-zone schematic uses simplified bands; neither makes those classifications interchangeable. [2] [1]
Likewise, an animal icon in a diagram is illustrative. It should not be read as a complete distribution map or proof that the pictured species occupies every depth in the band. [1]
Make the upper ocean legible without distorting it
Consider an 11-kilometre ruler drawn at a single linear scale. The upper 200 metres occupy 0.2 ÷ 11, or about 1.8% of the ruler’s height. That makes the sunlit layer difficult to see, even though its boundary is important. A designer can add an inset that expands the upper ocean, provided it is clearly labeled as an expanded view rather than part of the same scale. [1]
For a readable illustration, mark 0.2, 1, 4 and 6 kilometres on the main ruler, show the light gradient in a separate column, and identify the seabed separately. Avoid extending one universal light, temperature or oxygen profile across the whole ocean: the supplied guides support conventional zone boundaries and broad relationships, not a site-specific profile. [1] [2]
Sources & further reading
Have a correction or a source to suggest? Send a note →