
Reading path: Coastal water observation →
ORIGINAL ANALYSIS OF PUBLIC NOAA OBSERVATIONS
Two stations, the same UTC week
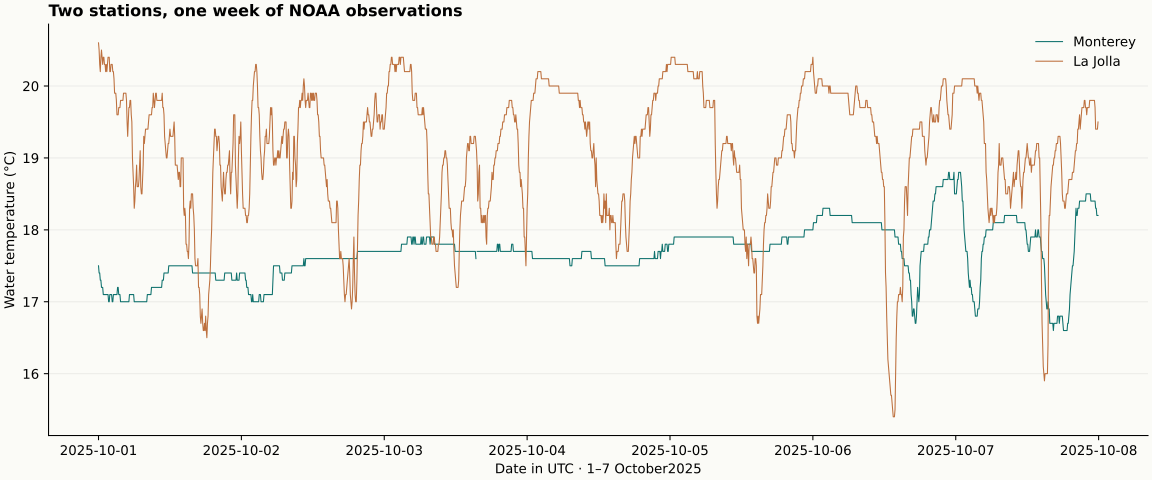
This historical snapshot covers 1–7 October 2025 UTC. The CSV retains 3360 timestamped records: 3359 numeric values and 1 blank flagged reading. It is not a live report.
| Station | Valid / expected | Mean °C | Min–max °C |
|---|---|---|---|
| Monterey · 9413450 | 1679 / 1680 | 17.68 | 16.6–18.8 |
| La Jolla · 9410230 | 1680 / 1680 | 19.11 | 15.4–20.6 |
Download all observations and flags (CSV)
Download daily calculations (CSV)
Daily values and calculation method
Arithmetic mean/minimum/maximum of finite numeric six-minute readings grouped by UTC date; no interpolation; blank values and original quality flags retained in CSV; no claim of independent verification.
| UTC day | Station | Valid n | Mean °C |
|---|---|---|---|
| 2025-10-01 | Monterey | 240 | 17.27 |
| 2025-10-02 | Monterey | 240 | 17.48 |
| 2025-10-03 | Monterey | 239 | 17.75 |
| 2025-10-04 | Monterey | 240 | 17.60 |
| 2025-10-05 | Monterey | 240 | 17.86 |
| 2025-10-06 | Monterey | 240 | 18.06 |
| 2025-10-07 | Monterey | 240 | 17.77 |
| 2025-10-01 | La Jolla | 240 | 19.01 |
| 2025-10-02 | La Jolla | 240 | 18.95 |
| 2025-10-03 | La Jolla | 240 | 19.05 |
| 2025-10-04 | La Jolla | 240 | 19.35 |
| 2025-10-05 | La Jolla | 240 | 19.22 |
| 2025-10-06 | La Jolla | 240 | 19.19 |
| 2025-10-07 | La Jolla | 240 | 19.00 |
What the sensor metadata does—and does not—tell us
Monterey: the metadata retrieved on 29 October 2026 lists the water-temperature sensor elevation as -6.83 feet relative to MLLW. Inspect station sensor metadata.
La Jolla: the metadata retrieved on 29 October 2026 lists the water-temperature sensor elevation as -11.26 feet relative to MLLW. Inspect station sensor metadata.
These elevations are not the sensor’s depth below a moving water surface, and this current metadata does not independently establish the sensor’s position in October 2025. The station contrast is descriptive; it does not isolate the cause of temperature differences.
A comparison with a defined window
From October 1 through 7, 2025 UTC, the downloaded NOAA station records give a mean water temperature of 17.68°C at Monterey and 19.11°C at La Jolla. The difference, 1.43°C, is our arithmetic subtraction of the two calculated means; it is not a separate NOAA observation. These are historical measurements for a particular week, not a description of current coastal conditions. [1]
The comparison is useful as a demonstration of method: define a time window, use the same units and time standard at both stations, then compare summaries. A mean can make a week easier to describe, but it compresses variation. It cannot by itself explain why the stations differed.
How the summaries were made
The underlying records consist of six-minute water-temperature readings. Our analysis groups finite numeric readings by UTC date and calculates an arithmetic mean, minimum, and maximum without interpolation. For the seven-day window, Monterey has 1,679 readings out of 1,680 expected; La Jolla has all 1,680. Daily values use the available readings, so a missing observation is not silently filled in. [1]
The UTC choice matters when comparing dates. A station’s local calendar day can begin and end at a different time than a UTC day. NOAA’s retrieval API supports time-zone choices and identifies water temperature as a meteorological data product. A reproducible comparison should record the requested interval, station identifiers, units, time zone, and treatment of missing values. [1]
Read variation before interpreting causes
The weekly means hide short-term spread. Monterey’s weekly minimum and maximum are 16.60°C and 18.80°C; La Jolla’s are 15.40°C and 20.60°C. The wider La Jolla range shows that its readings varied more during this interval, but a range alone does not reveal the timing or cause of the changes. Daily summaries or a time-series plot would help identify when excursions occurred. [1]
Coastal upwelling offers one possible physical context: alongshore winds can move surface water away from shore, allowing colder, nutrient-rich water to rise. That process can affect coastal temperatures, but the temperature comparison here includes no wind observations or direct measure of vertical water movement. It therefore cannot establish that upwelling caused any particular reading or the difference between these stations. [2]
Metadata is part of the measurement
The station metadata list the water-temperature sensor elevations relative to MLLW, or Mean Lower Low Water. Those elevations are referenced to a tidal datum; they are not depths below the changing sea surface. The metadata snapshot was retrieved in October 2026, so it does not independently establish where the sensor sat during the October 2025 record. [1]
A careful field note would keep the station and date beside every summary, preserve the original quality flags, and label calculations as calculations. This prevents a two-station weekly comparison from being mistaken for a coastwide pattern or a causal result. NOAA’s API allows observations to be retrieved by station, product, date range, units, and time zone, making those choices explicit and repeatable. [1]
Sources & further reading
Have a correction or a source to suggest? Send a note →